Power BI makes it easy to create reports and dashboards that summarize very complicated data sets and analyses, but what if you need to dig into the details for some part of your report? That’s where Power BI drill through comes into play. Let me show you how setting up Power BI drill through can help any of your report users see the data behind a certain data point.
There are many reasons you might want to take advantage of the Power BI drill through functionality. At Cobalt, we like the way it allows us to create a single report that can be useful for business users at every level, even though they each have a wide variety of needs.
Management can use it for high-level KPI tracking, and on-the-ground sales people can use it for individual activity analysis. Power BI drill through makes it possible for everyone from our business and sales development representatives to our CEO see as little or as much information as they want when they pull up a report.
Let’s dive into a real scenario our Cobalt team faced recently and show you exactly how we used Power BI drill through to solve the problem.
Cobalt’s Real-World Power BI Drill Through Scenario
Our Director of Sales wanted a report where he could quickly check how our Business Development Representative (BDR) outreach is going in any given week. We have always tracked sales outreach, but this added layer of insight, accountability, and data became especially important as our team made the shift from working in the same office to working from home.
The most important reason to track our sales efforts, however, is to create and track a conversion rate for outreach. How many emails, phone calls, and points of contact does it take for a prospect to accept a meeting with our team? Knowing your conversion rate is critical to ensuring your BDRs are on pace to hit their sales goals.
Our Director of Sales mostly wanted to see the basics at a glance — how many outreach attempts has each BDR completed with a breakdown by outreach type (email vs. phone call). On the other side of things, our BDRs and Account Executives also wanted to see those count totals. But in addition, they needed to see more information about the details of those outreach effort totals. They want to see which organizations that we reached out to, the number of employees at that organization, etc.
How To Build a Single Report for Multiple Business Users with Power BI Drill Through
If you aren’t familiar with Power BI and its awesomeness, don’t let the detail in the how-to steps below feel overwhelming! Get a general feel for the workflow and then contact us for a Power BI demo or a customized product showcase. We will walk you through the basics and quickly give you a sense of all the other major value Power BI and the Power Platform would have for your team.
Step 1: Start with your visual that will provide the greatest level of details
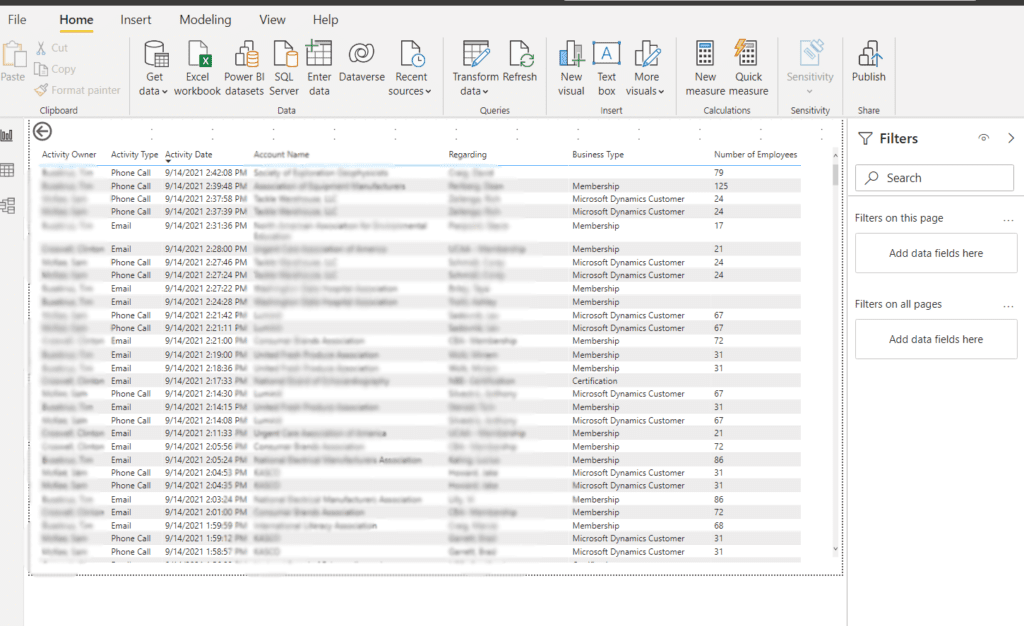
The biggest key to Power BI drill through is that you need to work backward. Think first about the most granular level of detail you want to show and start by creating a page with that visual. We will call this page our Activity Log.
In our case, we know our BDRs and account executives (AEs) wanted to see information about the outreach activity itself, but also information about the organization connected to the lead. So, we need to create a table (using the table visual) that includes the following columns:
- Activity Type
- Activity Date
- Regarding
- Business Type
- Number of Employees
We will eventually add drill through fields to this page, but I think the best way to visualize which fields you should add is to create a second page for your report before we do so.
Step 2: Create a new page with your most high-level visuals
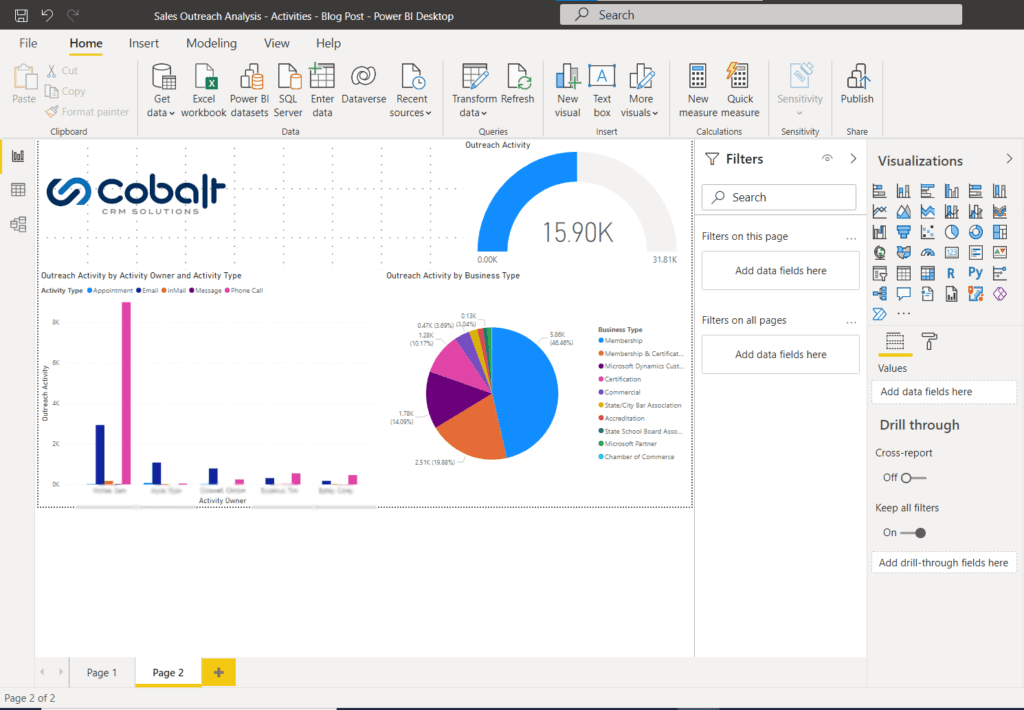
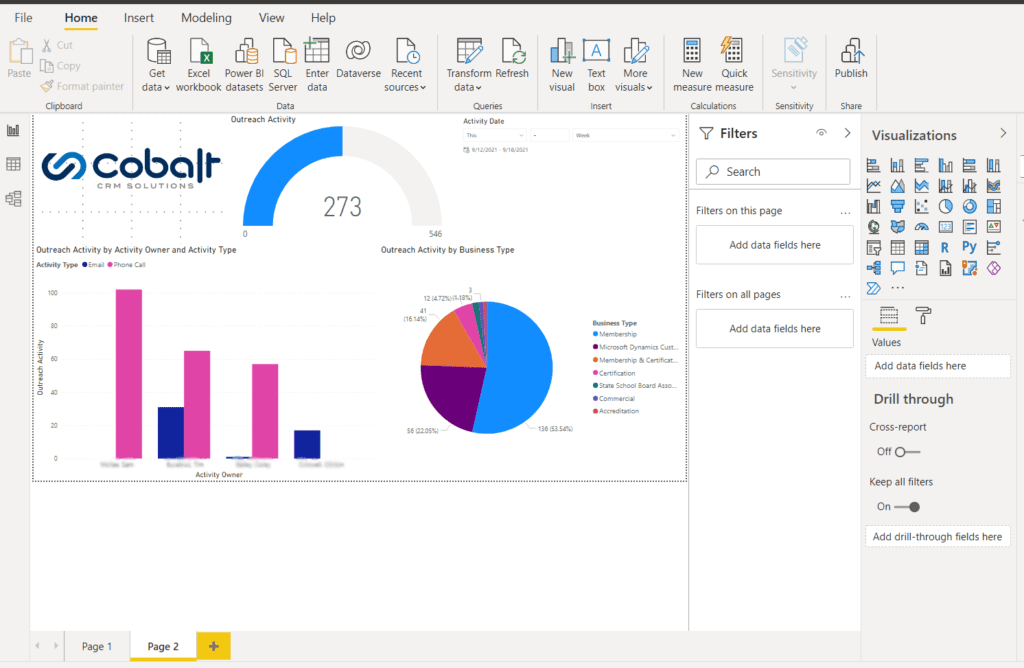
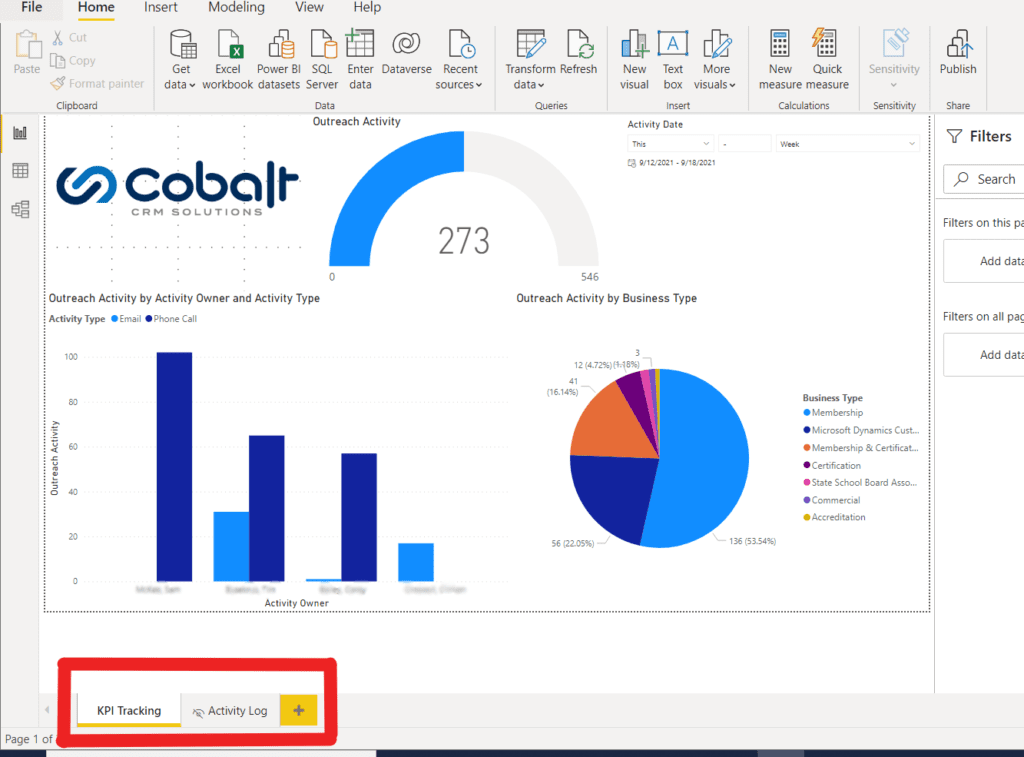
This second page will include the most high-level visuals we want to see. We will call this our executive level page. We know our Sales Director wants to see the following information for the current week, so we include the following visuals:
- Total number of Outreach Activities
- Outreach Activities Broken Out by BDR and Activity Type
- Outreach Activities Broken Out by Business Type
Step 3: Add a Power BI slicer for this week
Our visuals are currently showing all-time outreach activity. Let’s add a slicer to make it easy for our Sales Director to filter results just for this week.
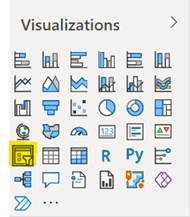
1. Create a slicer visual
2. Drag your date field to the field option
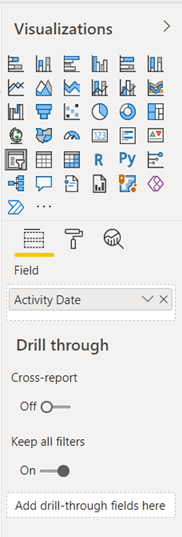
3. Change the dropdown to ‘Relative Date’
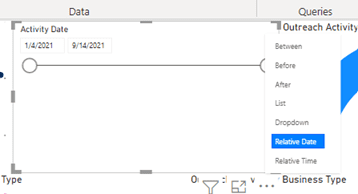
4. Update the filter to default to ‘This Week’
Now we are seeing our high-level numbers for this week:
Step 4: Setting up the Power BI drill through fields
Let’s switch back to our Activity Log page now that we have a handle on what we need to see from a high level.
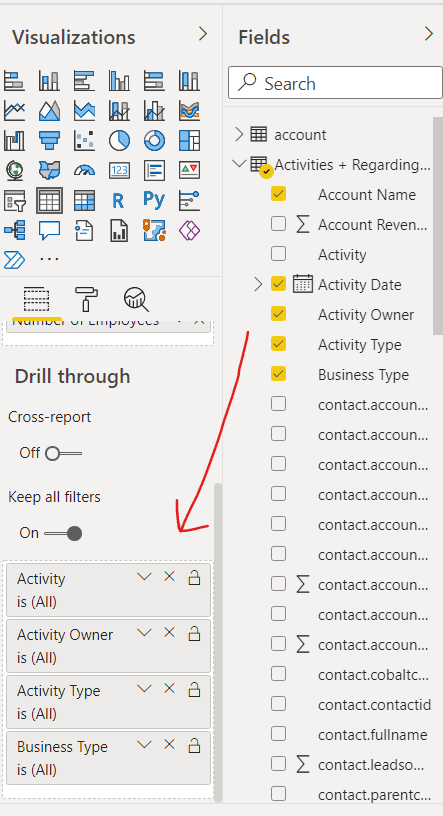
At this point we should choose which fields from our Executive Level page we will want to drill into. We’ve decided we want to see a more detailed outreach log by activity, activity owner, activity type, and business type.
To enable the Power BI drill through functionality, you simply need to select your visual and drag the fields to the Drill through section:
Once you’ve added your drill through fields, you should rename your report pages. That is because when someone uses the drill through functionality, they choose which report to drill through too, so naming the pages can make it easier on the end user.
Step 5: Publish your new Power BI report
Go ahead and publish your report and let’s see a glimpse of how it would look and function in two different scenarios.
Scenario #1
Scenario #2
One great feature of the drill through functionality is that your filters are maintained throughout. For example, you will remember our Activity Log page wasn’t filtering on activities this week, but our Executive Level page was. When we drilled through to our BDR’s activity, it not only filtered on his activity, but it also filtered the results so we only saw the outreach from this week.
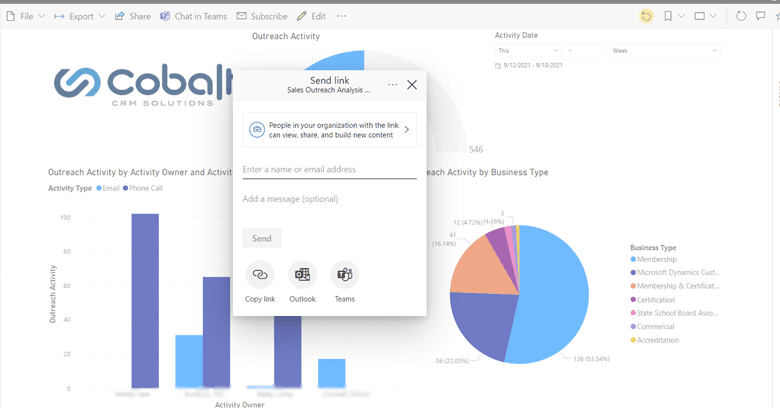
Sharing the reports with the Sales Team
Giving the rest of the Sales team access to the report is easy — you just share the report with the necessary people. You can even embed the report into Dynamics for Sales or Microsoft Teams for quick access. This is a great option for the Sales team that will be really digging into the report and using it in their day-to-day efforts.
Sending a PDF to Executives
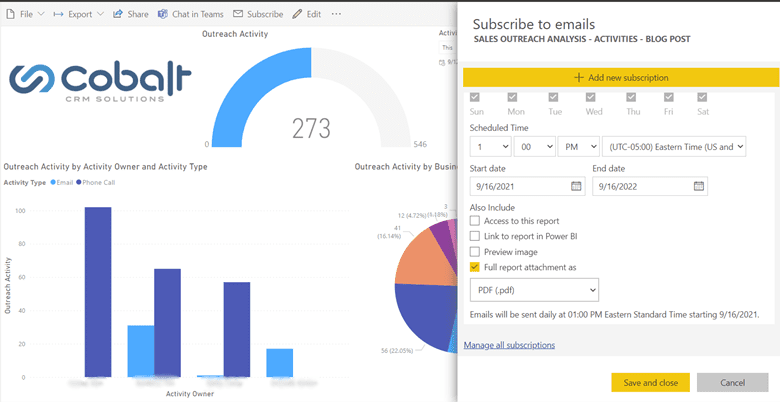
One of the great things about the new Premium by User licensing options is the ability to automatically send employees a PDF version of the report, without them needing to navigate to Power BI. This is perfect for the CEO who wants to see the numbers, but won’t necessarily want to take advantage of the dynamic slicing and dicing of the data.
An emailed PDF of the report is easiest for them. To set up a PDF subscription, you just click the ‘Subscribe’ button and check the ‘Full report attachment as’ option:
If you are interested in Power BI and want to learn more, shoot us a quick note below!
What about out-of-the-box reporting in Dynamics for Sales?
I hope our real-world Power BI drill through scenario has helped you clearly see some of what’s possible for the full range of your business users. But I also realized that you might be thinking … this seems like a long article for a simple report. After all, if you are using already using Dynamics for Sales, there are a ton of great out-of-the-box reporting options — no Power BI needed, right?
It’s true that Dynamics 365 is already packed with potent reporting capabilities, but in addition to the slicing and drill through functionality I’ve demonstrated here, Power BI’s unique functionality came out way ahead in our recent Power BI vs Dashboards in Dynamics 365 Showdown.
If you’re considering adding Power BI or the other pieces of the Power Platform to the mix for your team, we believe you will see a significant multiplication of the Dynamics 365 value for your staff and customers. Reach out for a quick introductory call with one of our Power Platform experts. We’ll show you more about Power BI drill through functionality, answer your questions, and highlight the specific value of the Power Platform for your team.

Connect with a Power Platform Expert
Fewer manual tasks. Powerful business insights. Microsoft license optimizations. Targeted training for your team to use these tools the ways we do every day. Let’s take 15-30 minutes to explore what Cobalt and The Power Platform would do for your team.