Here’s an exciting event you don’t need to RSVP to: we’re launching Power BI dashboards!
We’ve built a (sweet) suite of Power BI dashboards, all centered around the same goal: making your day-to-day reporting easier. After spending our fair share of time knee-deep in spreadsheets and charts, trying to figure out whether or not our latest event was a success compared to previous years, we’ve decided that enough is enough.
So put your hands up, we’re playing our song… if our song was an easy-to-use, interactive, and straightforward dashboard that provides a snapshot of your event registrations and trends over the last few years. Sure, you could manually go and figure out your overall attendance rate, your registration cost on average, or general registration trends, but why should you have to? The Events Snapshot dashboard has those data points ready, and more, no calculations needed. Now that’s something to nod your head like “yeah” for. #PartyintheCRM
Why?
The best part about events management isn’t the reporting you need to do afterwards. But it’s important information to know, so you can plan even better events in the future. Our solution is the Events Snapshot dashboard in Power BI. With the dashboard, you can get all of the high-level information you need to plan effectively for next year’s events. It’s the perfect starting place for some seriously in-depth reporting and analytics about your events.
Got Questions?
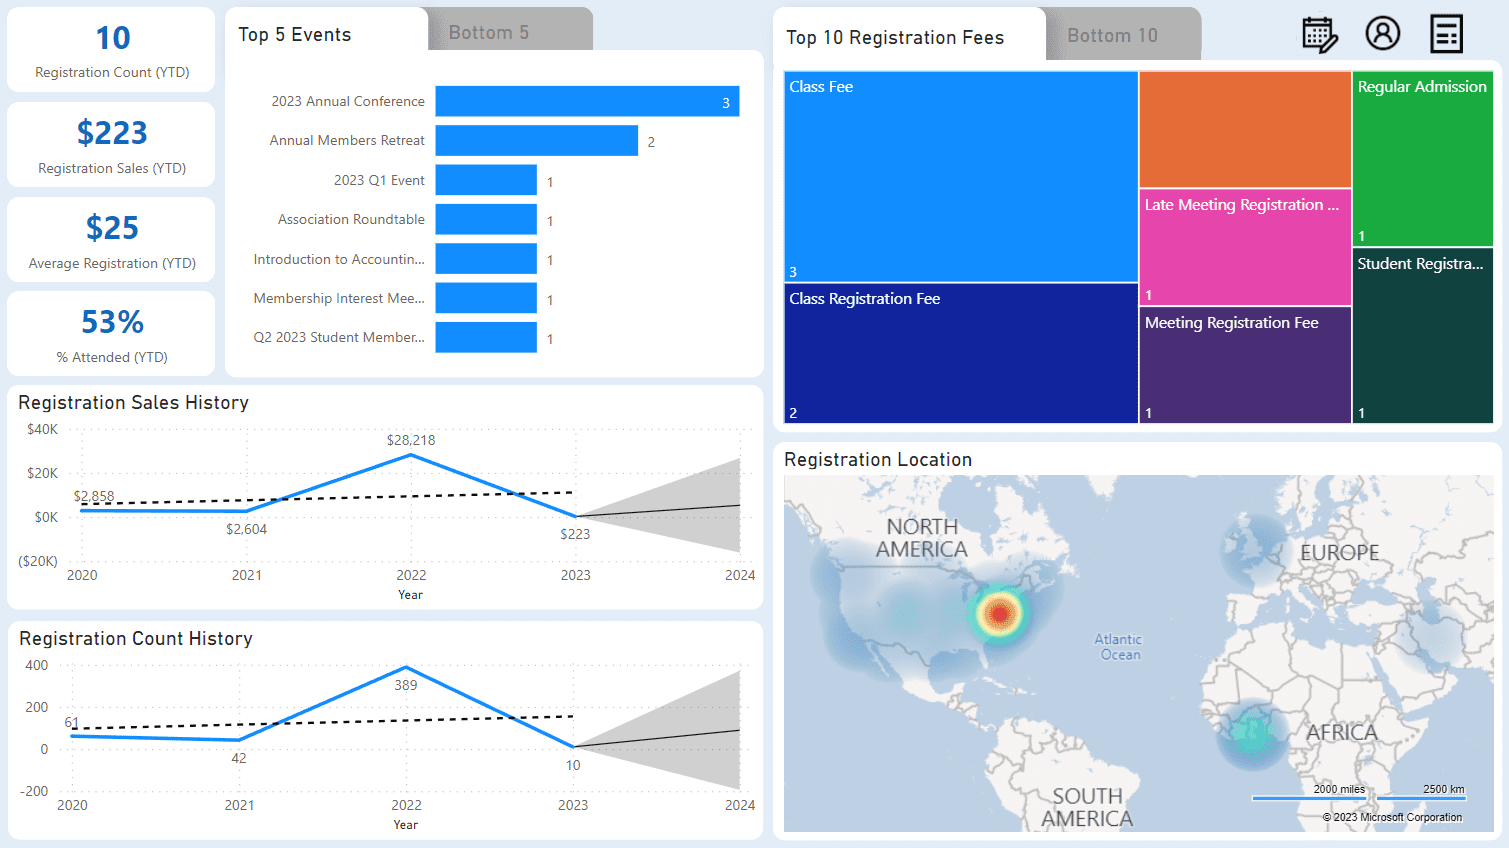
The dashboard has answers to these questions and more:
- How many people are registered?
- How much money have we made this year on the events registration?
- How much are people paying (on average) for events?
- What is the attendance rate?
- What events get the most registrations; what have the least? Should we continue offering the events with the least registration or should we advertise them more?
- What is the most common type of registration fee and what is the least selected? Should we offer different packages?
- Have the events sales increased over the years? Are there any trends over the past few years?
- Have the events registrations increased over the years? Are there any trends over the past few years?
- How does the same event (e.g.: annual conference) compare with the sales and registrations over the last three years?
- Where are our attendees located? Should we plan to have a meeting closer to where they are?
- Do we have any trends based on gender?
- Do we have any trends based on age?
- Do we have any trends based on education?
How Does it Work?
- Users can add the Events Snapshot dashboard for an immediate plug-and-play experience. No additional customizations needed, you can start using it right away.
- Staff members can interact with the dashboard and filter using the visuals and additional filters. Let’s get this party started!
Want to learn more about this feature? Check out our release notes.