This is our dashboard confessional — we’re really excited about this one.
A member of our new (sweet) suite of Power BI dashboards, the eCommerce Snapshot Power BI dashboard provides you with a one-stop-shop to see your products, sales history, and trends. Time is money, so we want you to save money while you report on your money. Money moves, indeed 🤑.
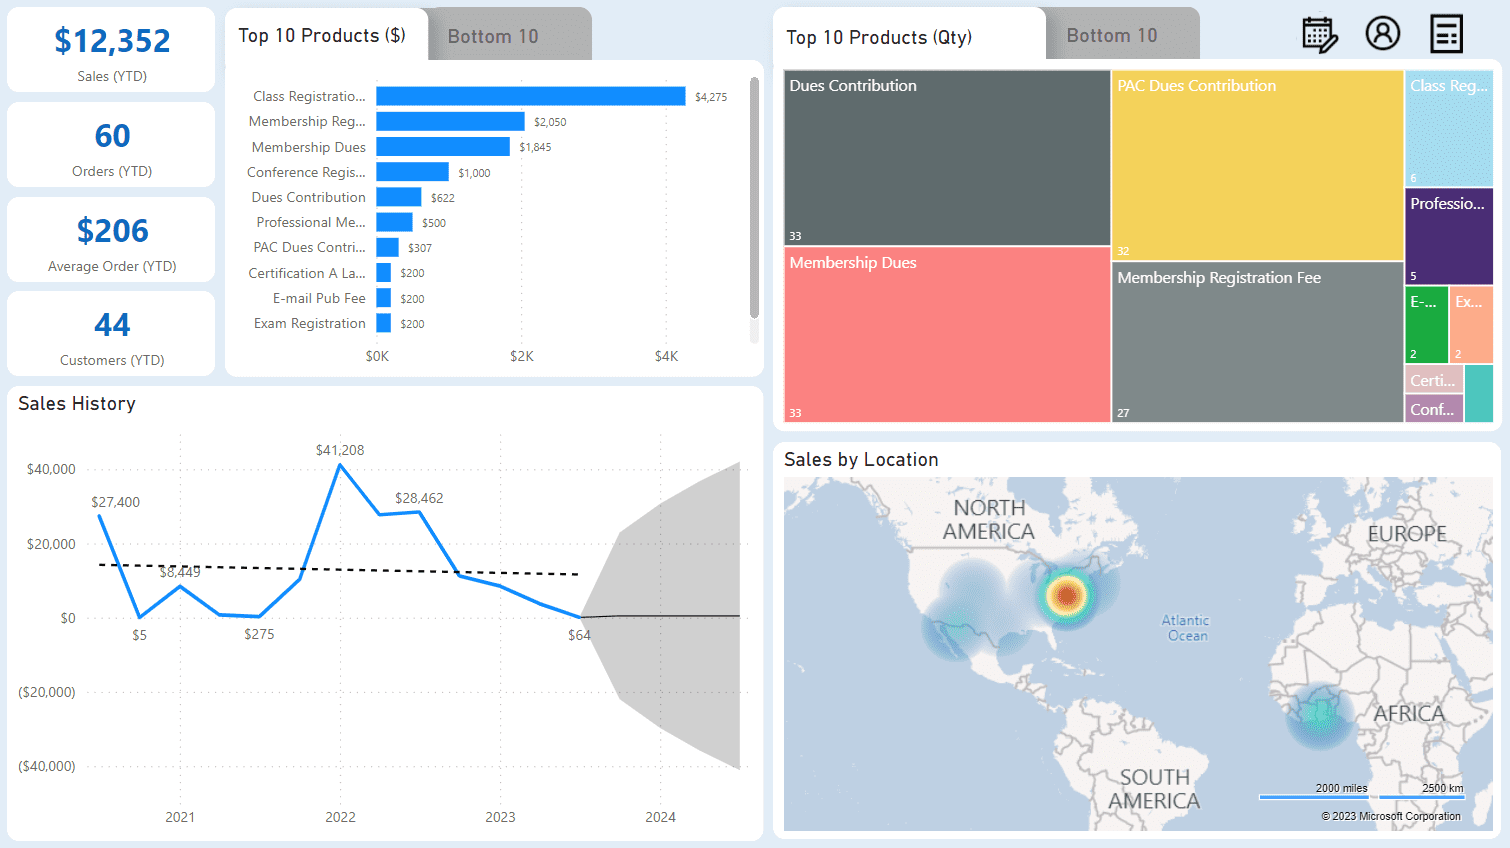
Take a look at the dashboard and see for yourself! We’ve done the hard stuff — all you have to do is use it.
Why?
You’ve got questions, and we want to give you a faster way to get answers. The eCommerce Snapshot dashboard gives an overview of the sales made in the year to date, and answers questions about the best (and worst)-selling products, average orders by quantity and sales, and general customer trends. It’s the perfect starting place for some seriously in-depth reporting and analytics about your sales.
Got Questions?
The dashboard has answers to these questions and more:
- How many sales have we made this year?
- How many orders have we fulfilled this year?
- What is an average order?
- How many customers purchased something from us this year?
- What did we sell?
- What are our top and bottom products by amount and by volume?
- Where are our customers located?
- Do we have any trends based on gender?
- Do we have any trends based on age?
- Do we have any trends based on education?
How Does it Work?
- Users can add the eCommerce Snapshot dashboard for an immediate plug-and-play experience. No additional customizations needed, you can start using it right away.
- Staff members can interact with the dashboard and filter using the visuals and additional filters. #nofilter or all the filters, the choice is up to you.
Want to learn more about this feature? Check out our release notes.