The paginated report Power BI generates for printing or sharing is built to impress, and easy to turn out. It does require the proper Power BI license and the Power BI Report Builder, however. Don’t worry, if you are using Power BI Free or Power BI Pro, you still have plenty of powerful report sharing options. In this post I’ll walk you through exactly what you’ll need and how to create a paginated report in Power BI Premium.
See exactly which Power BI license you need (with pricing details):
Power BI Free vs Pro vs Premium
Save money on your Power Platform or Dynamics 365 licenses:
Read about Cobalt’s pricing optimization services
“Why is my Power BI report not printing properly?!”
While it’s no secret that Power BI is a powerful tool, let’s be honest: the data visualizations and other elements are optimized for exploration and interactivity, not for printing. Try to print a page from your Power BI report, and you’ll find that the beautiful interactive report you’ve created has now been chopped down to only what was visible on the screen at the time.
So, what do you do when you want to create a printable report using Power BI? This is where a paginated report Power BI creates is the ideal solution!
What are paginated reports in Power BI?
Before we talk about Microsoft’s Power BI platform, let’s take a quick step back. Paginated reports are designed to be viewed on a digital or printed page. Microsoft’s Power BI paginated reports are “pixel perfect,” since they are highly formatted and optimized for printing and PDF generation. As with other Power BI reports, you can effortlessly combine data sources, create data visualizations, and share the reports you create. The biggest difference with a paginated report Power BI Premium users can make is that you can print all of that data in a table, no matter how long.
When should I use a paginated report?
One of the most useful things about all of the Power BI versions is that you have a range of export and sharing options for your reports for internal and external users. Sharing a Power BI report in Dynamics 365 Sales or Microsoft Teams is seamless. Embedding a report in an external website is easy. Read more about these Power BI report sharing options.
But sometimes, you need a printable option or more control over your digital presentation. You can utilize Power BI’s paginated report features and capabilities to work in your favor to develop and render a compelling, highly formatted report that will make anyone on your team look like a report genius.
Choose a paginated report when:
- The report must be printed or displayed on a page (like in a PDF document).
- You want a high degree of control and formatting ability in designing the report.
- Large amounts of data from a table need to be exported.
You can always use paginated reports side by side with Power BI reports, so you can have the best of both worlds!
What do I need to set up Power BI paginated reports?
As I mentioned earlier, Power BI Premium license is required to publish and manage paginated reports. If you’re not exactly sure who needs what license on your team, this is a place where Cobalt’s deep Microsoft experience will help. We’re really good at optimizing the user licenses for teams using Dynamics 365, the Power Platform, and other Microsoft tools. Odds are good we can find a way to save you money — just reach out and set up a free licensing consultation with our team.
With a Power BI Premium license in hand, you’ll also need the right report designer. Microsoft’s Power BI platform has two different report designers – Power BI Desktop and Power BI Report Builder. To create a paginated report, you will need Power BI Report Builder. The official download and system requirements page for Power BI report builder is here.
Getting started with paginated reports in Power BI is easy, but as with all the Power Platform tools: the depth of possibilities goes on and on. If you decide you want to take a deep dive on learning the full range of capabilities with paginated reports in the Power BI report builder, Microsoft has authored a free, detailed course you should check out.
The course consists of 26 videos across 8 modules. With just under 4.5 hours of content, you could finish the tutorials in a day and be the resident expert on your team around topics like:
- Designing report layouts
- How to connect different data sources
- Working with parameters in Power BI
- Advanced data visualization techniques for your reports
- How to include interactive features in reports
- How to publish, share, and embed paginated reports
If you can’t devote extensive time to the online tutorial, or your team consistently needs help navigating how to get what you need from Dynamics 365 or the Power Platform, let’s talk about Cobalt’s support and managed services.
Paginated Report Power BI Tips & Best Practices
Once you’ve downloaded Power BI Report Builder, you are all set to get started with creating paginated reports with Power BI! Creating paginated reports can seem intimidating at first glance, with all of the application tools in the builder, but it can be a straightforward process with a little practice and some tips and tricks we’ll share with you here:
Getting Started:
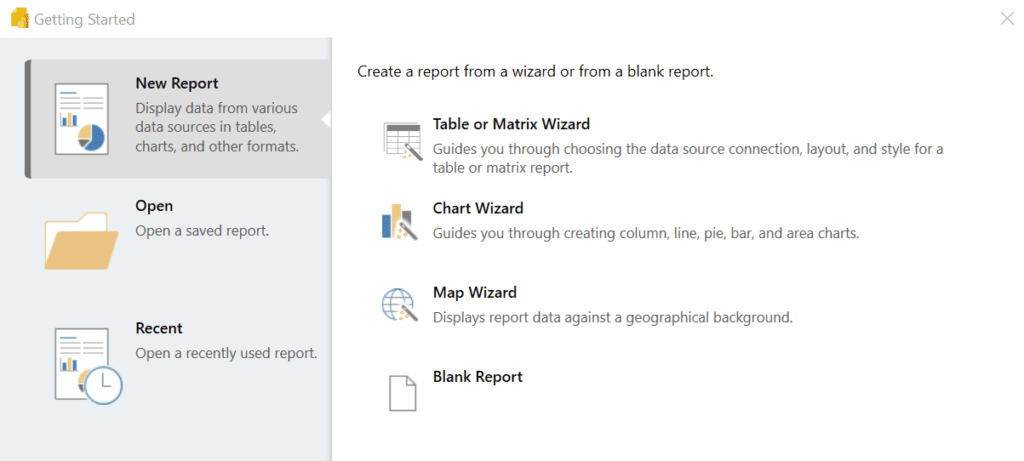
- You can create a new Power BI paginated report from a variety of starting points in Power BI Report Builder. You can choose the “Table or Matrix Wizard” for a guided start, which is what we recommend for new paginated report Power BI users.

- You can also choose “Blank Report” for more control over how you’d like to build your report.
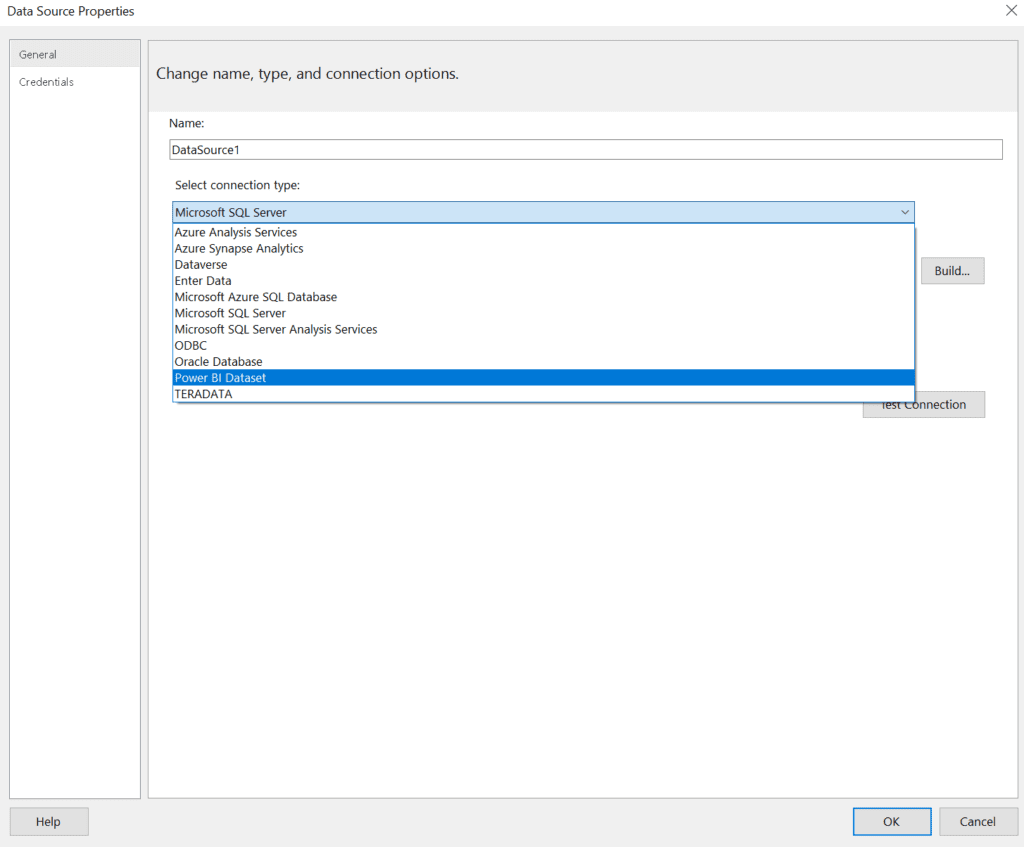
- Either option will ask you to create a dataset for your report. You can connect to a wide variety of different data sources, but generally this will be a Power BI Dataset.

Already have a dataset?
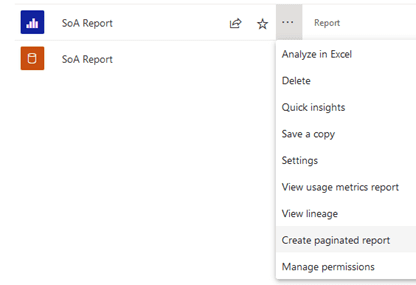
- If you already have a dataset uploaded in your Power BI Service Workspace, you can click on the More Options button on that dataset (it will be the three dots icon) to reveal the “Create a paginated report” option.
- You can also do this with an existing report to create a paginated version of that Power BI report.

Creating paginated reports in Power BI: Best Practices
- When creating paginated reports in Power BI, we recommend that you develop a report that requires reuses components. The less maintenance, the better. Reduce and reuse what you can; it’s not just useful to save the Earth, it’ll help your paginated reports!
- While paginated report Power BI functionality offers a lot of customizability, reduce the visuals used to ensure your page layout is easily readable.
- Keep it simple and reuse your datasets. Your Power BI paginated report should use the same dataset that the normal Power BI report is sourced from. This ensures your data is consistent while saving you time when changes need to be made!
Previewing your paginated report:
- After you’ve added visuals and properties to your paginated report, you can preview it to test the functionality.
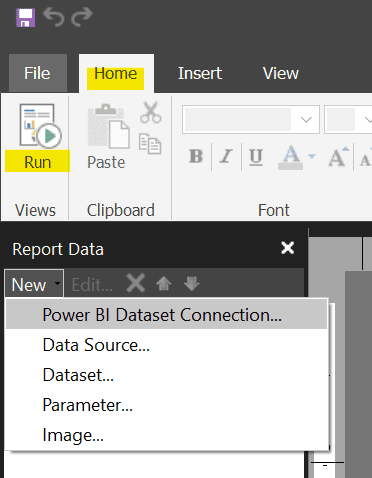
- To preview, find the Home tab and select “Run”. You’ll be able to test the functionality of the report or modify the layout of the print format.

- Want to see what your report looks like in different formats? No problem! The paginated reports Power BI report builder makes can be exported as a sample in Word, Excel, PDF, and other file formats.
Help! My team can’t see my published report!
- After you’ve finalized your Power BI paginated report and clicked “Publish”, it will be visible within your workspace. If you or others are having trouble seeing the data, check their permissions for the dataset that the report is using. Users must have Read permission and must be added to the appropriate Role Level Security role.
The Power Platform Expertise You Need
Paginated reports and Power BI reports are optimized for different purposes; they are complementary tools that will increase your reporting solution’s business value. If you want to explore and interact with your data visualizations, choose Power BI reports. If pixel-perfect reports that should be printed or shared are your goal, use Power BI paginated reports! If you have a paginated report Power BI question, or want to explore specific ways The Power Platform would amplify the value of your CRM, let’s connect for a quick conversation!

