Integrating Power BI, Google Analytics, Dynamics 365 Sales, and Dynamics 365 Marketing into one dashboard is not only possible, but also seriously, seriously worth the effort. In my related post, I outline four scenarios that underscore the value of tighter sales and marketing alignment.
In this post, I’m going to show you exactly how to pull Power BI, Google Analytics, Sales, and Marketing all together, step-by-step.
Side Note: Not using D365 for Sales or Marketing? If you just want a Power BI Google Analytics combination, skip to this step.
Step 1: Choose a Dynamics 365 Marketing Template
Dynamics 365 Marketing stores data differently than Dynamics 365 Sales. You might not even notice the difference if you are in your D365 environment, but once you try and bring this marketing data into Power BI, you will see it is harder to work with than your typical database.
Luckily, Microsoft has published some Power BI templates explicitly for use with Dynamics Marketing.
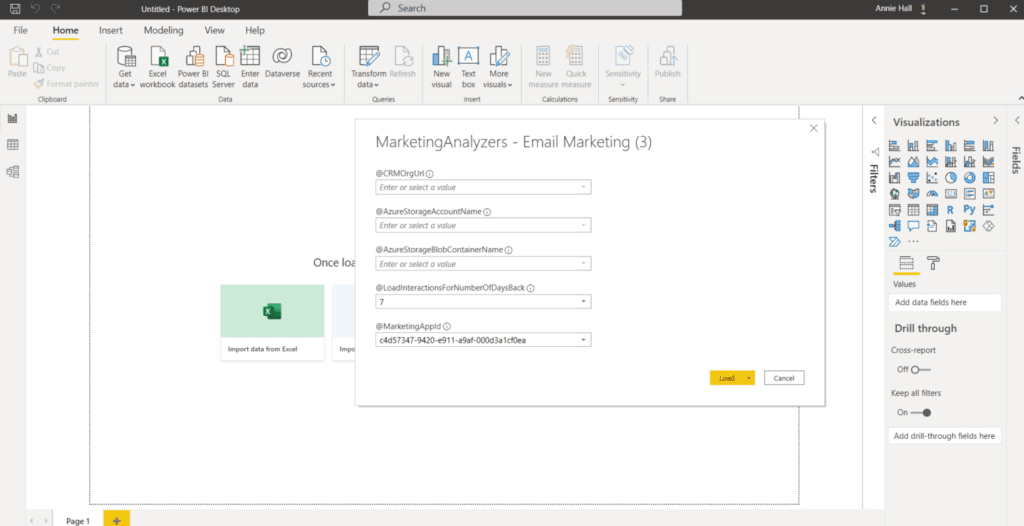
Once you explore the different templates and choose the one you want to start with, go ahead and download the report file. You will be prompted to connect to your Dynamics Marketing environment.
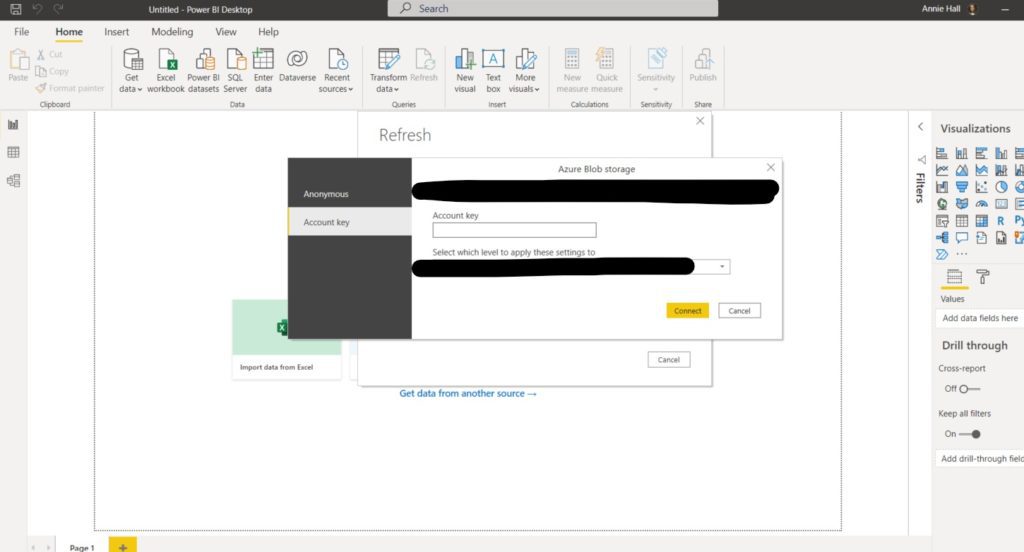
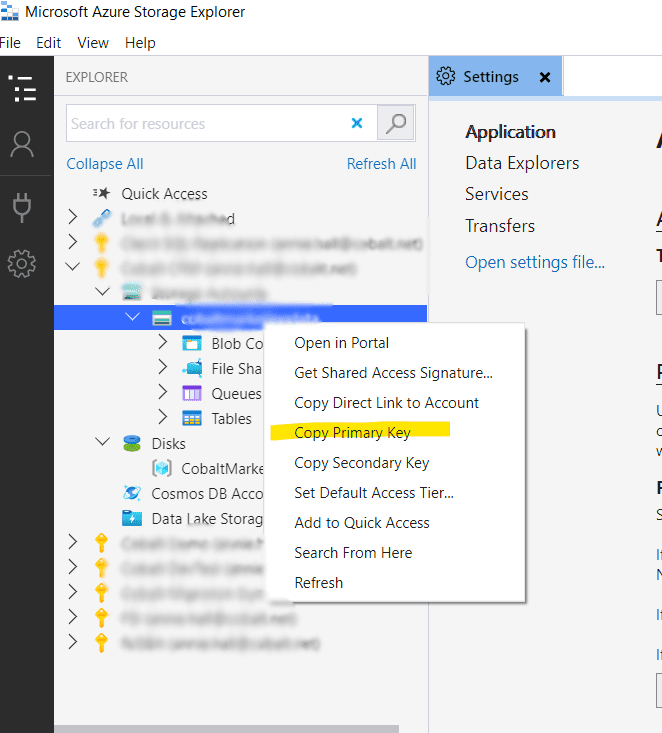
You will be prompted to enter in your account key, which you can get from Azure Storage Explorer:
Once your queries load, you will open your report and it should look something like this:
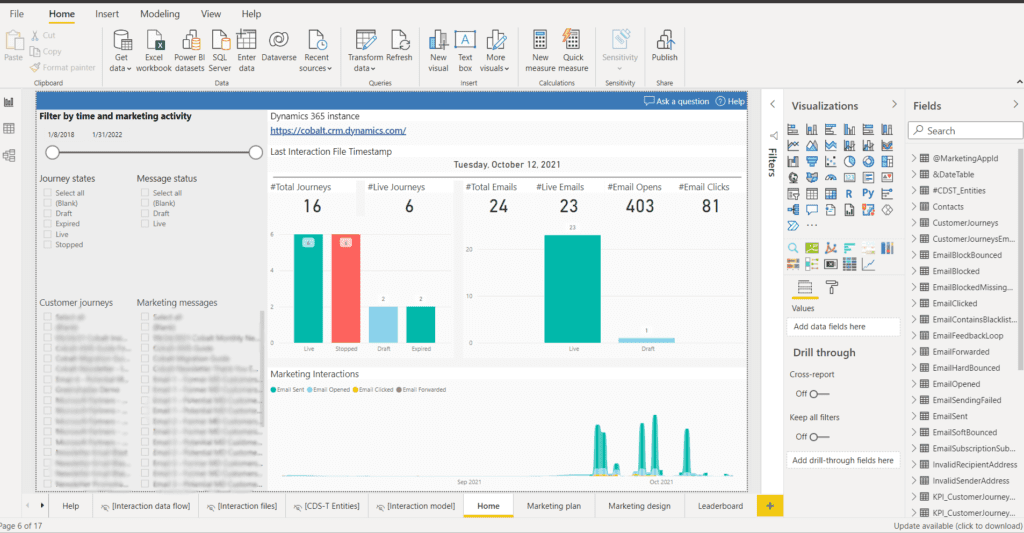
If you look at this report and immediately feel overwhelmed, you aren’t alone. This marketing report is basically aggregating a lot of the information already available in our environment, so if you are actively using your Marketing module, there is likely a ton of data gathered in this report.
What do we want to know?
Before we get any further, let’s identify a couple of metrics we want to see in this dashboard:
- Clickthrough rate
- Open rate
- Bounce rate
These metrics will help us measure both individual email performance and the health of our email lists.
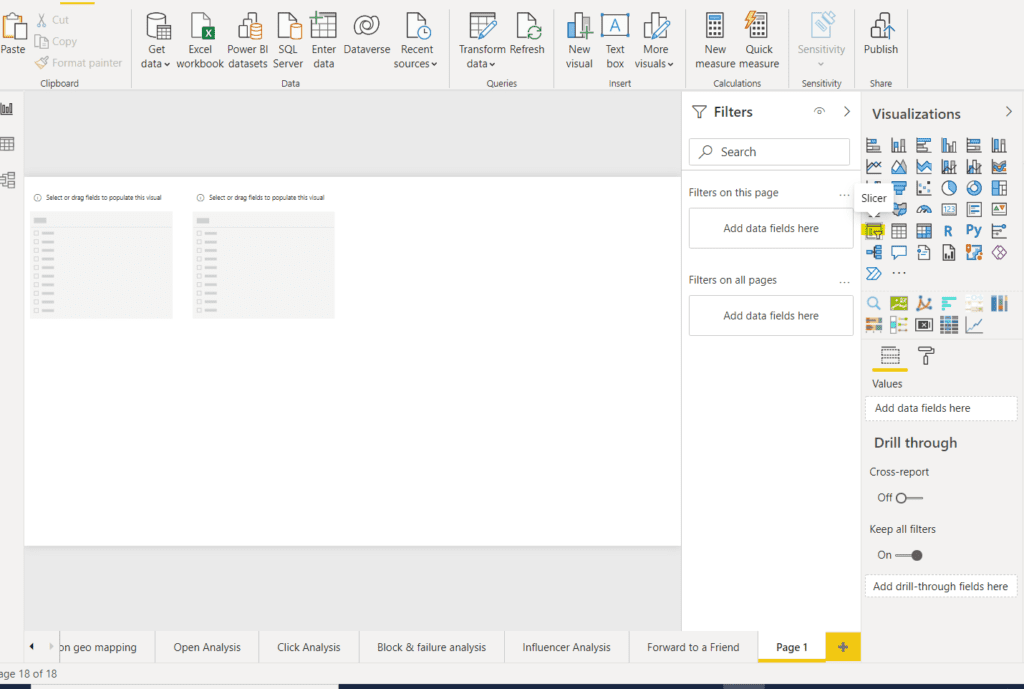
Once you know what numbers you want to see and you’ve taken the time to explore the different options, I think the easiest way to build your own report is to start with a new page.
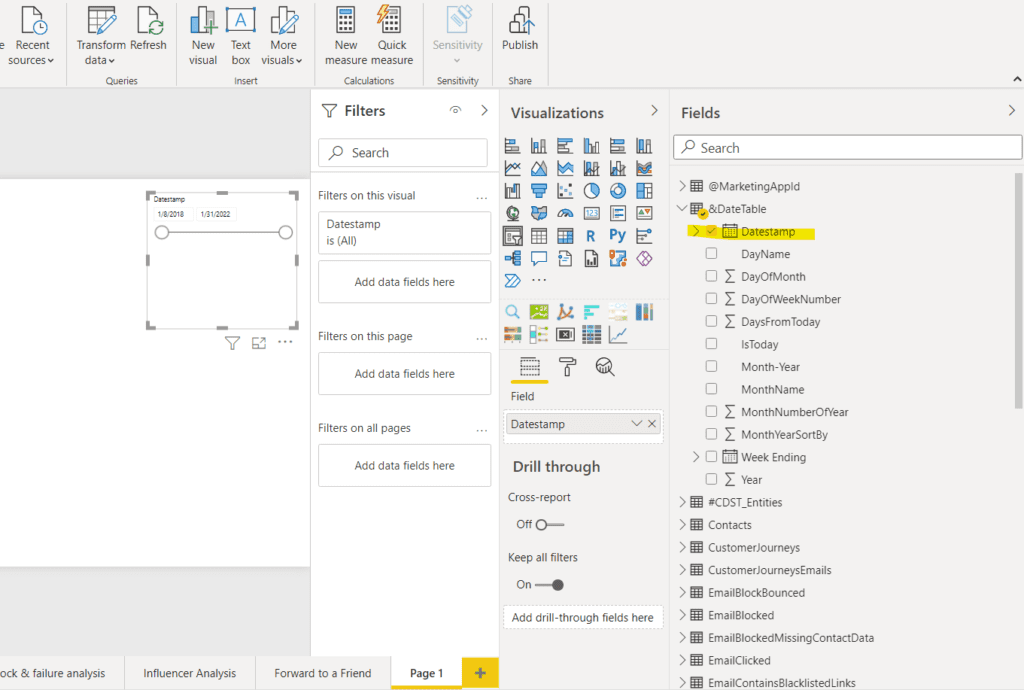
What filters do we want to be able to apply to the metrics?
You need to decide how you will want to slice and dice your data.
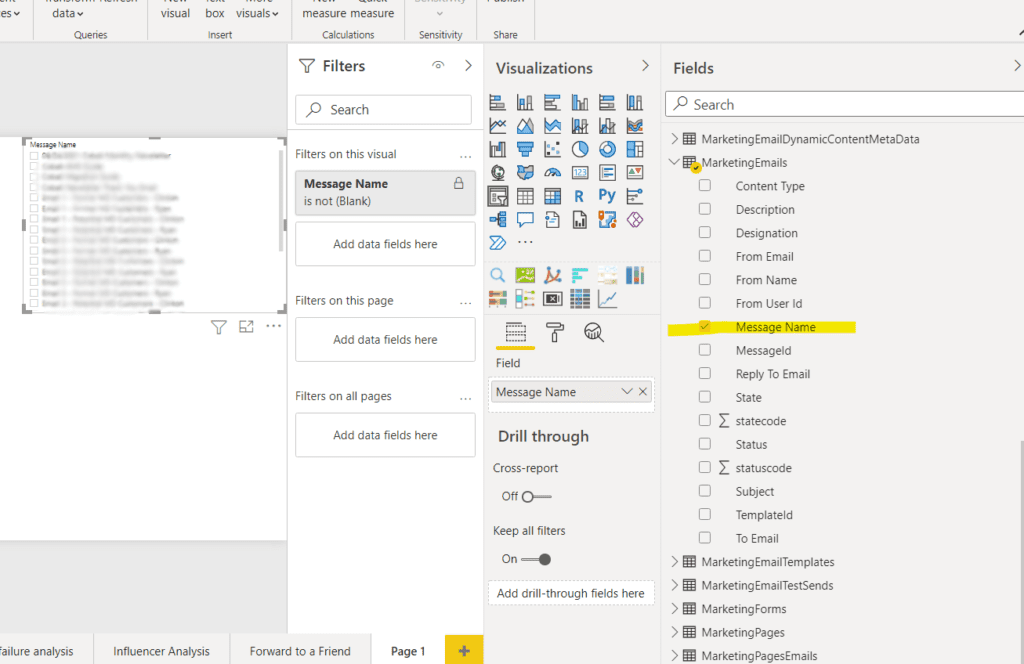
I know I want to be able to see the above metrics segmented by two main things:
- Email Message
- Date
How do we want to create our dashboard?
Creating Measures
Now that you have your slicers set up, let’s get to work on using measures to get some of those numbers we need. Let’s use the clickthrough rate as an example.
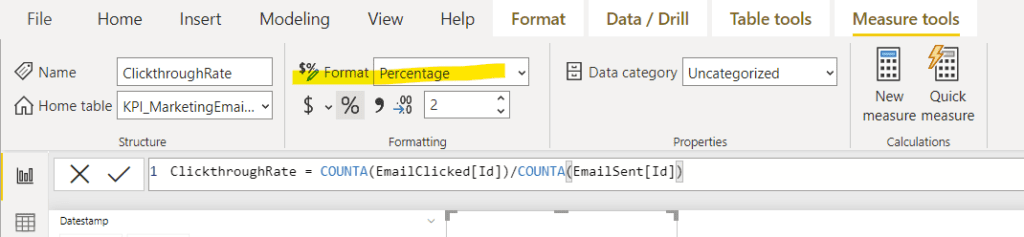
To calculate your click-through rate, create a measure with the following formula:
Clickthrough Rate = COUNTA(EmailClicked[Id])/COUNTA(EmailSent[Id])
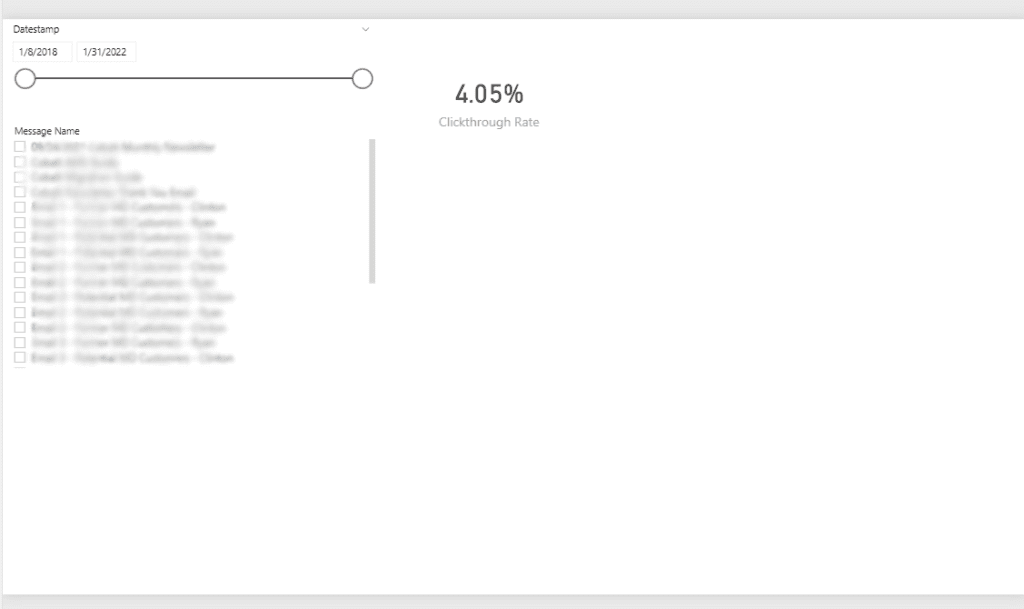
Create a new card visual and drag your measure to the card:
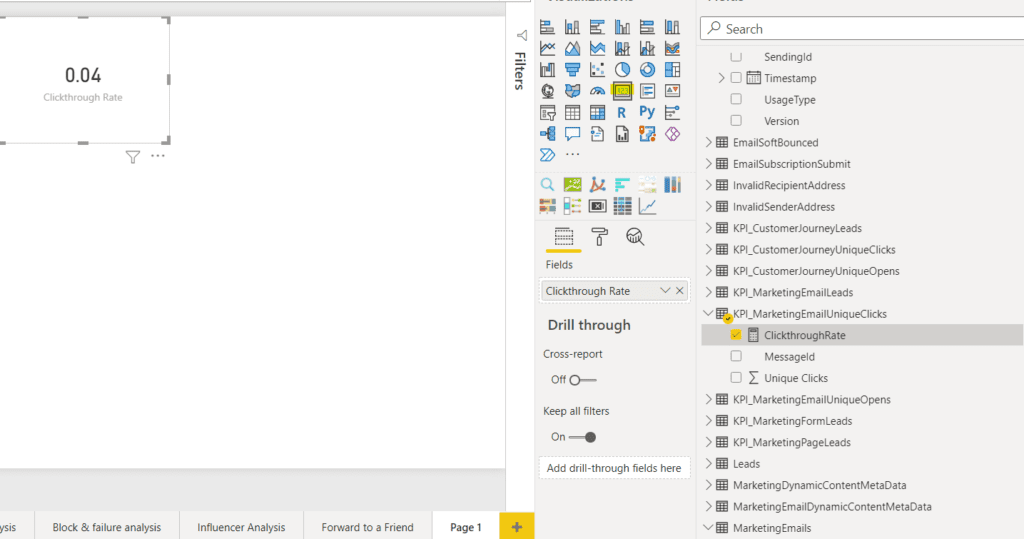
Then, click your measure and change your format to ‘Percentage:’
And you will end up with a card that looks like this:
You can use the following measures to calculate the open rate and the bounce rate:
Hard Bounce Rate = COUNTA(EmailHardBounced[Id])/COUNTA(EmailSent[Id])
Open Rate = COUNTA(EmailOpened[Id])/COUNTA(EmailSent[Id])
Once you’ve finished your email marketing data modeling, let’s say you want to include your Google Analytics Information.
Step 2: Connect Power BI Google Analytics
Now that you’ve finished your Dynamics 365 Marketing, let’s work on the Power BI Google Analytics connection. You can do this by following these steps:
1. Create a new page in your report
2. Click the ‘Get Data’ button and then click ‘More…’
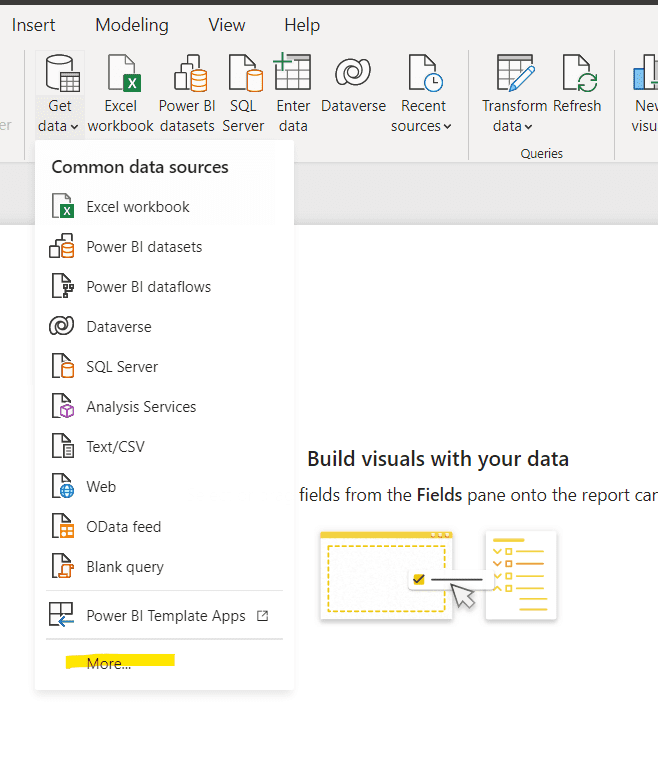
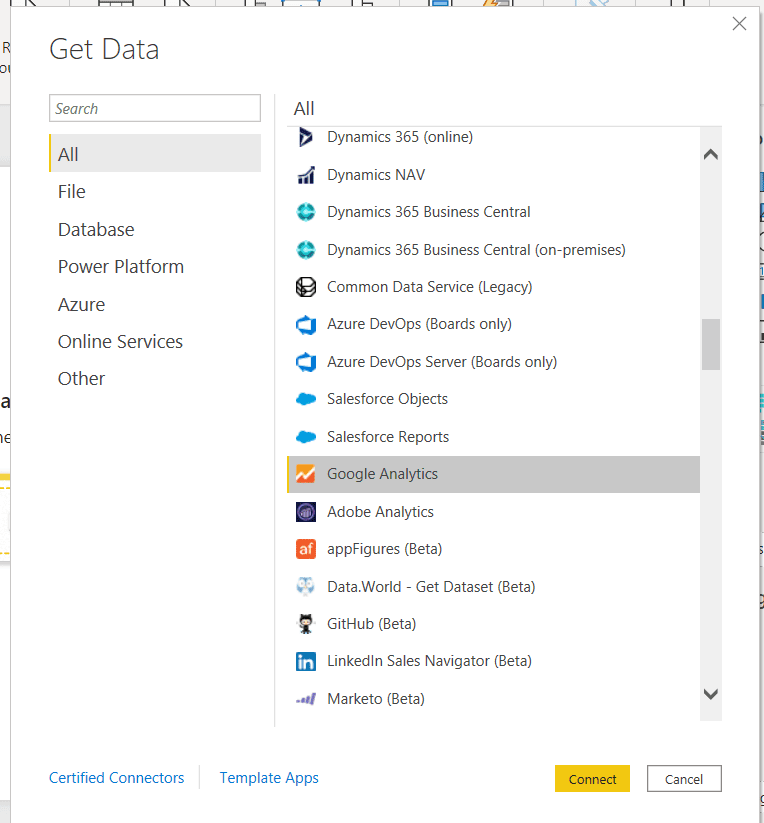
3. Select ‘Google Analytics’
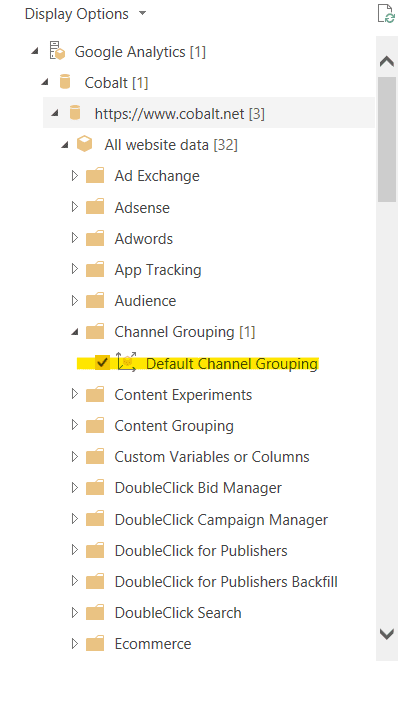
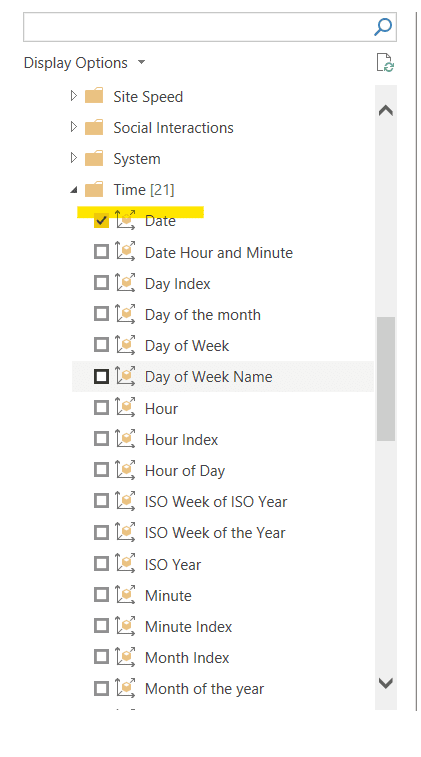
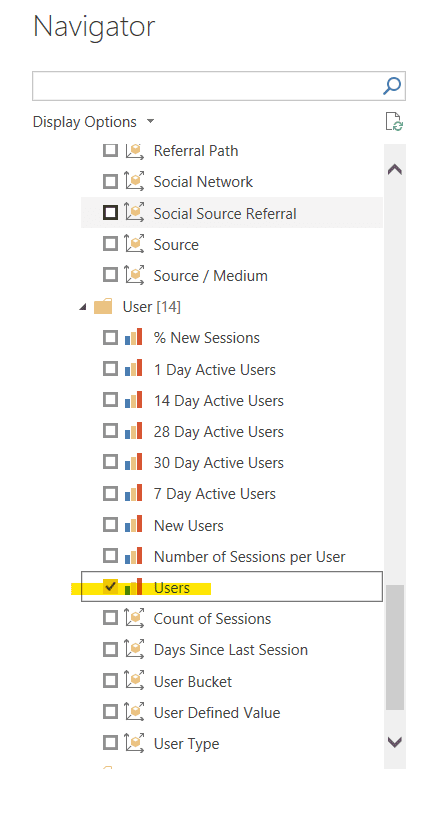
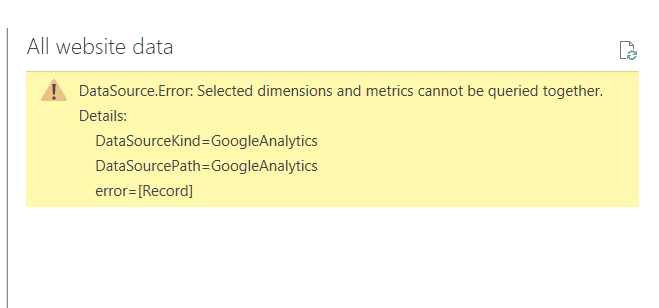
As with any dashboard, planning is key. You want to make sure you have an idea of the information you will want in your dashboard. We’ve decided we want to know where website users are coming from and how they are navigating through our site. We have selected the following from the Google Analytics connector:
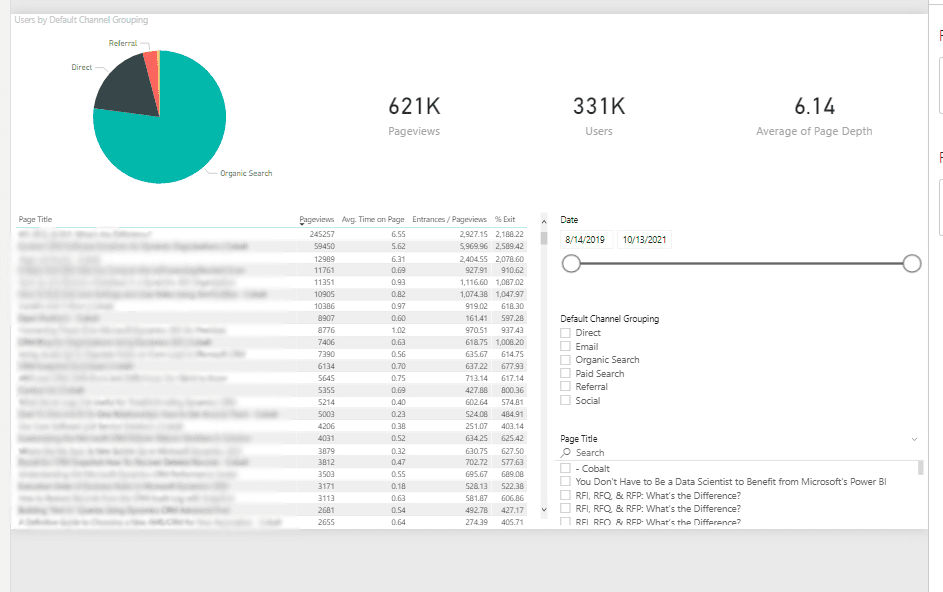
Once you’ve pulled in what you need from Google Analytics, you can start visualizing the data in a way that works for you. We’ve split our dashboard up into a few different parts:
- A pie chart that shows our website users by where they came from (i.e., organic search or they came directly to the website)
- Three cards that show total number of page views, users, and average page depth
- A table that shows different stats for each page on the website
- A slicer section that allows us to filter the rest of the report by date, channel grouping, and page title
Once you’ve finished with your Google Analytics page, you are ready to move onto the final step: connecting to your Dynamics 365 Sales Environment.
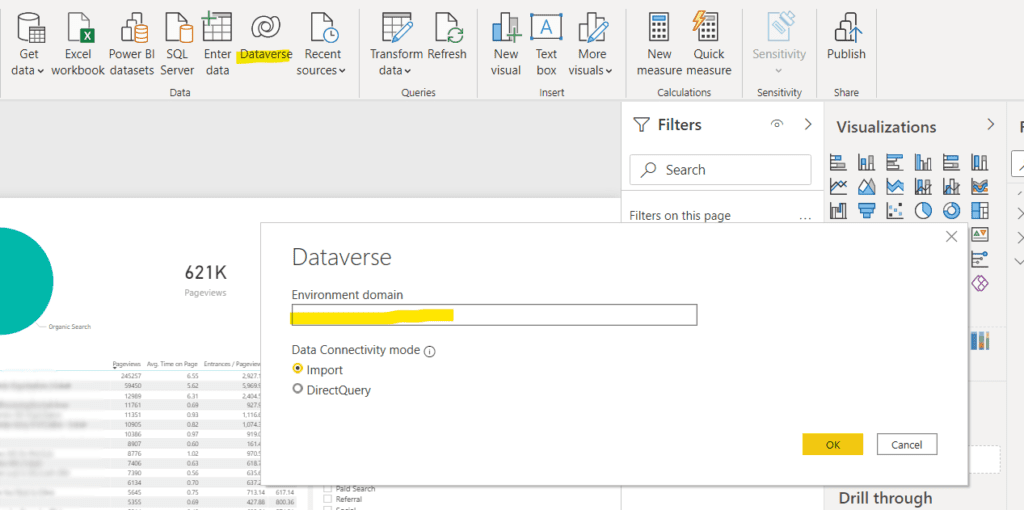
Step 3: Finish by Connecting to Dynamics 365 Sales
To connect to your Dynamics 365 Sales environment, all you need to do is click the ‘Dataverse’ button and enter your environment URL:
Once you are connected to your environment, you will be prompted to pull in the entities you want to report on. We pulled in the following:
- Account
- Contact
- Lead
- Opportunity
- Activity Pointer
- Phone Call
Since we’ve already gone through several different visuals and measures using both Dynamics 365 Marketing and Google Analytics, I’ll skip the mechanics of the sales dashboard bells and whistles. If you’ve followed along this far, you get the point and hopefully you’re ready to customize your new dashboard!

Connect with a CRM Expert
We use the tools we sell every day. Let our team show your team how to get the most out of your CRM investment. Take a moment to save time for a brief introduction call with one of our Dynamics 365 and The Power Platform experts.