What is D365 Embedded Power Bi?
Power BI is one of the four products that make up Microsoft’s no code/low code business application platform—the Power Platform.
The BI in Microsoft’s Power BI stands for business intelligence. Using D365 Embedded Power BI enables business users to easily create dashboards that make sense of disparate data points. It tells a story about your data—this is hugely beneficial for marketing and business planning purposes (not to mention the dashboards look super sweet).
Power BI has a huge customer base and works for organizations of any size. Microsoft touts Conde Nast and Adobe as users, but many of Cobalt’s small association clients also leverage Power BI’s capabilities along with the rest of the Power Platform.
Because it has such a strong following, a quick Google search to find out if Power BI is right for your organization can yield millions of results.
We are here to alleviate that sense of being overwhelmed and to show you one example of how associations can leverage Power BI’s data analysis capabilities with Cobalt’s out-of-the-box engagement scoring to identify at-risk members.
Engagement Scoring in Dynamics
Engagement scoring is a great way for associations to keep a pulse on their membership.
The idea behind an engagement score is every time a member does something (registers for a class, subscribes to an association’s blog, etc), their engagement score goes up. A high engagement score is usually a good indicator that the member will renew come dues season.
The specifics behind our engagement scoring functionality are as follows: when a contact engages with the organization, the system automatically creates an engagement activity for that person and defines the point value for that activity based on the activity type.
For example, in the below screenshot, you can see that Rudolfo Benmore receives 5 points for a forum comment and Kimberly Wane gets 10 points for volunteering.
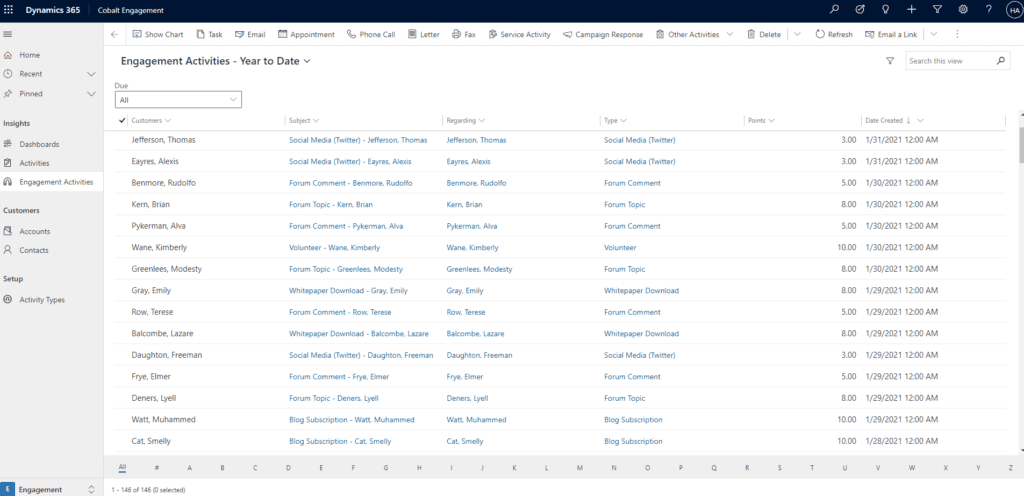
We then use a field that sums the engagement activity points for that person and displays it on the contact record.
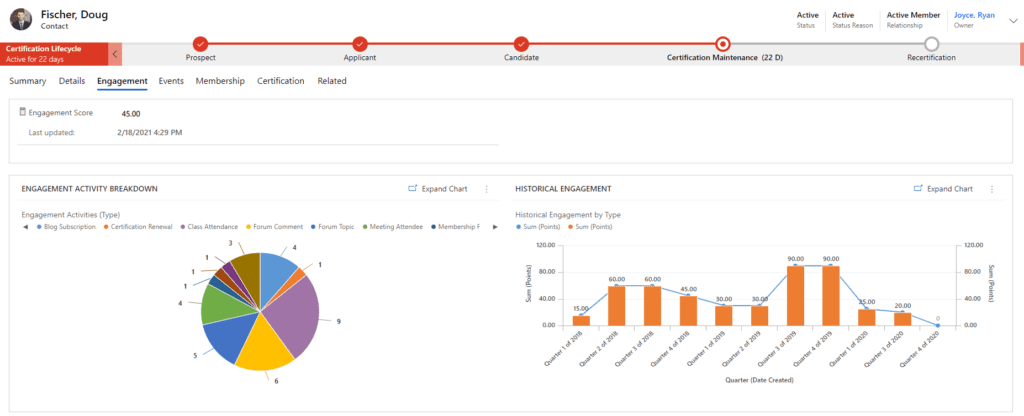
As you can see, the engagement score is in a central location on the contact record. At any time, a staff member can view a contact’s current engagement score, along with a breakdown of the engagement activities by engagement type and the engagement score over time.
Organizations can determine which activity types they would like to score and easily configure those in the system. Here are some common engagement activities and point values to get you started:
- Class Attendance (5)
- Blog Subscription (10)
- Forum Comment (5)
- Committee Participation (10)
- Annual Meeting Registration (10)
Our scoring system provides organizations complete control over what constitutes engagement and how certain activities are weighted against others.
Cobalt’s out-of-the-box engagement scoring functionality is simple, and can be configured (without any help from IT!) to address more complex scenarios if needed.
Using Engagement Scores in D365 Embedded Power Bi
An engagement score doesn’t mean much without any context— this is where Power BI comes in.
Once you’ve configured your engagement scores in Dynamics, you can connect your Dynamics instance to Power BI to create macro level visualizations that give you a 360 degree view of your engagement activity data through D365 Embedded Power Bi.
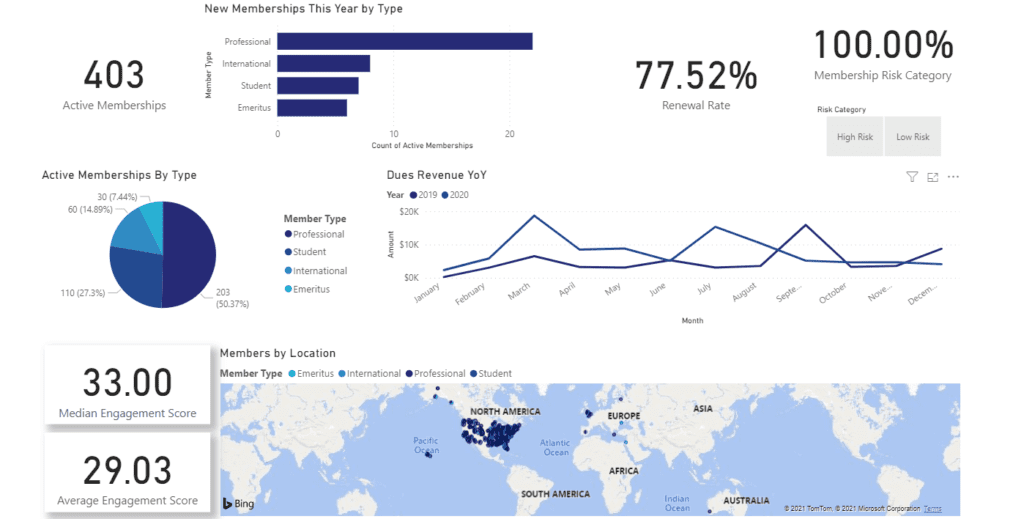
One of the great features of Power BI is it’s ability to do quick calculations and display that information on a card. We’ve used the card visual to display the median and average member engagement scores on our Executive Membership Dashboard.
These measurements are helpful for two reasons:
- They provide context for a single engagement score. A staff member can use this information to know what is “normal” when they look at a contact’s engagement score.
- They help leadership keep a pulse on overall member engagement, which can then be used to guide organization efforts. If those numbers are usually in the 40s, it might be time to launch a marketing campaign for a few upcoming classes.
You can even take these numbers a step further and configure your D365 Embedded Power Bi dashboard to use these measurements in other visuals. For example, we’ve used the median engagement score calculation to determine if a member is classified as low risk or high risk.
In this example, someone is classified as “low risk” if their engagement score is five or more points higher than the current median. Someone is “high risk” if their engagement score is 10 or more points lower than the median engagement score.
When we click ‘High Risk’ or ‘Low Risk,’ we can see what percent of our membership is in that category.
This is a great way to eliminate surprises come dues season—you can see exactly what percent of your membership is considered high risk and are not likely to renew.
Additional Benefits of D365 Embedded Power Bi
To conclude our discussion of Power BI, here are three other key benefits:
Dynamic Dashboards
You can use other visuals on the dashboard as slicers. For example, if you wanted to see the median engagement score for just one member type, you click on that member type in the pie chart and the other visuals will update accordingly.
Scheduled Refreshes
You may be doing some of this analysis in Excel already. Microsoft Dynamics makes it easy to export your AMS data to other Microsoft applications such as Excel. However, there are manual steps involved in that process, which means you won’t always have the most up to date information. With Power BI, you can schedule the data to be refreshed periodically throughout the day. No more exporting data manually from your AMS and manipulating it in Excel and sending those files out to other staff. It is all automatic and can be displayed in a central location.
Embed Right into Dynamics
You can embed Power BI dashboards right into your AMS—no need to go to a separate application to see Power BI data. This makes it easy for staff members to find the data they need to make data-driven decisions. There are so many possibilities like this for making your crew more efficient. Let’s connect for a quick introductory call soon to highlight ways to make their work easier and keep them focused on higher priority efforts.

Connect with a Power Platform Expert
Fewer manual tasks. Powerful business insights. Microsoft license optimizations. Targeted training for your team to use these tools the ways we do every day. Let’s take 15-30 minutes to explore what Cobalt and The Power Platform would do for your team.