So, you read our 2023 Association Management Software Buying Guide, you’re up and running with Dynamics CRM, collecting all that good data; it’s time to visualize it with a dashboard. The power is yours! Before you start building, you should know:
- Who is your audience?
- What will they use the dashboard for? Are they managing their daily tasks? Checking the pulse of the business? Making strategic decisions?
- What sort of metrics are important for this audience and their use case?
- Does the data exist?
You can be sure that the way you filter and display the information will change, and possibly the way you collect it – this is good! You’re getting to know your data and how it gets there. But even with the guaranteed change ahead, there is a formula to get you up and running now. No shock here: it starts with planning.
1. Create a Blueprint
- What metrics do you need to see? Over what timeframe?
- What views with what filters will show this data?
- What charts will slice it in a way that reflects the metrics? What fields are you using? Over what period of time?
- What entities will drive the views and charts?
You might end up with something like this:
- Metric = New Members by Type Approved Each Month
- Entity – Membership
- View – Memberships with Join Date This Year
- Chart – Member Type by Join Date | Month-Over-Month
- Metric = New Members by Type Approved Each Quarter
- Entity – Membership
- View – Memberships with Join Date This Year
- Chart – Member Type by Join Date | Quarter-Over-Quarter
- Metric = New Members by Type Approved Each Year
- Entity – Membership
- View – Memberships with Join Date in the Last 5 Years
- Chart – Member Type by Join Date | Year-Over-Year
- Metric = Returning Members by Type
- Entity – Membership
- View – Approved Reinstatements
- Chart – Memberships by Type
Tip: Use naming conventions. You can use these in a later step to track the elements you’ve created and keep them consistent and clear for other users.
2. Determine Your Audience
Is this dashboard for public consumption? Will you need to move it between CRM environments? Make it a system dashboard and head to your solution to start building – anything you build outside of the solution cannot be easily added later.
If this is just for you, and perhaps some friends, you can create your views, charts, and dashboard outside of the solution.
3. Build Your Views & Charts
Consider your filters carefully; if you want to preview views while you’re building, you’ll have to do so outside of the solution.
Check out details on how to create charts here. For views, click here.
4. Build Your Dashboard
- Choose your layout.
- Create components – choose from charts, lists, IFRAMEs and Web Resources.
- When adding chart or list components, choose from the views and charts you created earlier.
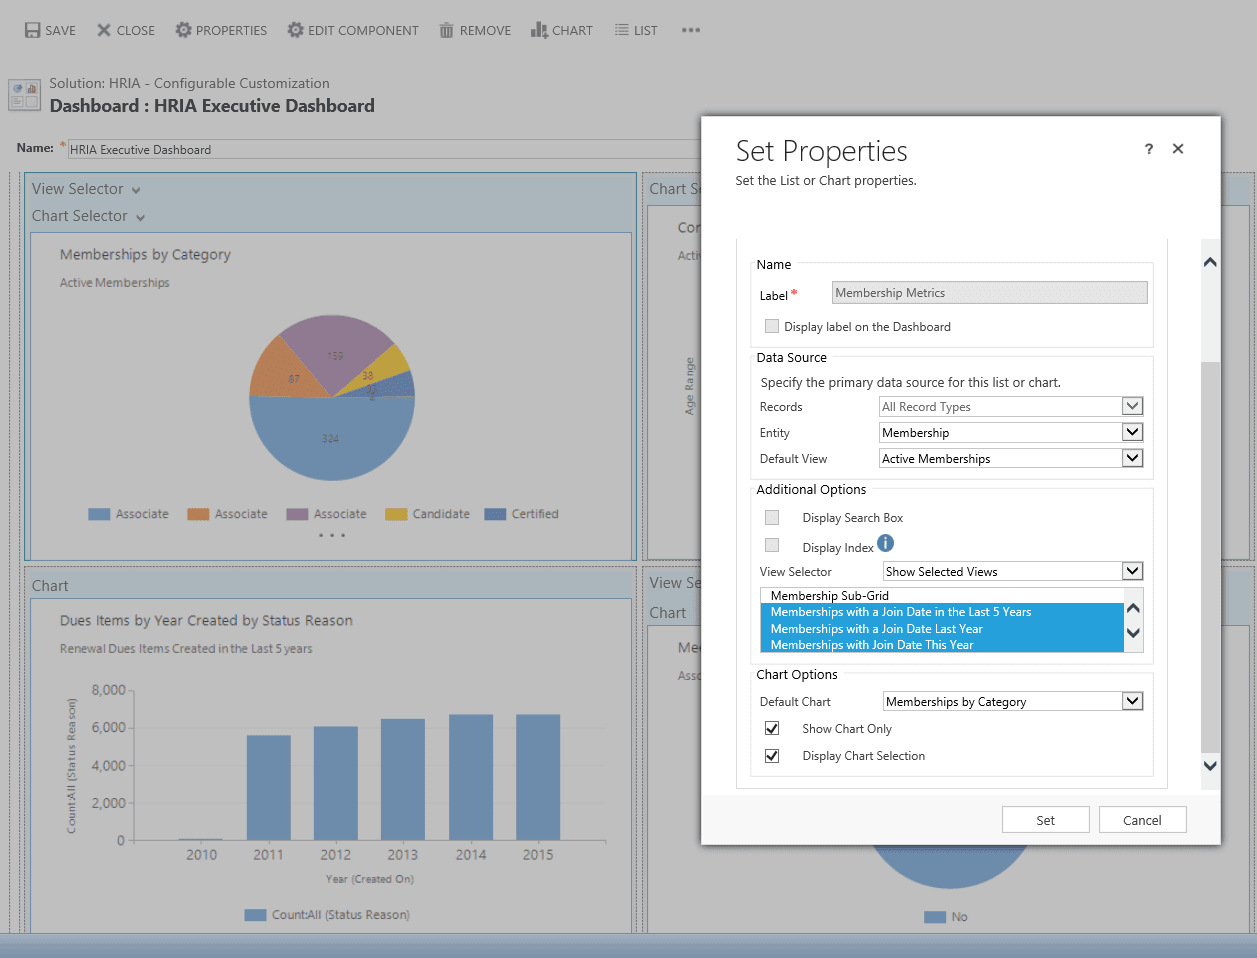
Do you have a lot of metrics? Do some of them hinge off of the same entity in CRM? Consider using multiple views and charts within the same component.
- You will need to have already created a component; just choose any one of the views/charts you wish to include when first creating it (you’ll add more in the next step).
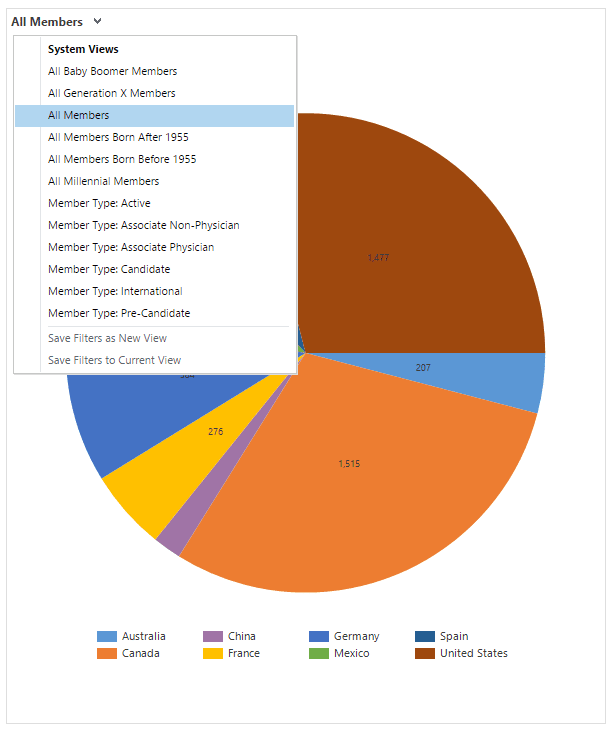
- Once the component has been saved, double click it to open the properties, and update the View Selector to add views. Check the Display Chart Selection checkbox to add charts.

Now, your users will be able to toggle between views and charts within the same component.

Have you run out of space on your dashboard? Microsoft sets a limit of six components, but you can increase this up to 20 – see Microsoft’s how-to here. Be forewarned, when you increase the components, you might also increase the load time for your dashboard; Microsoft set that limit for a reason.
5. Publish Your Customizations
You’re done! Or, done for now. Like everything in CRM, your dashboard will require maintenance as you come to understand your data, or as your processes and your data change.
